10-Q (Quarterly Report, SEC Filing)
Data Overview
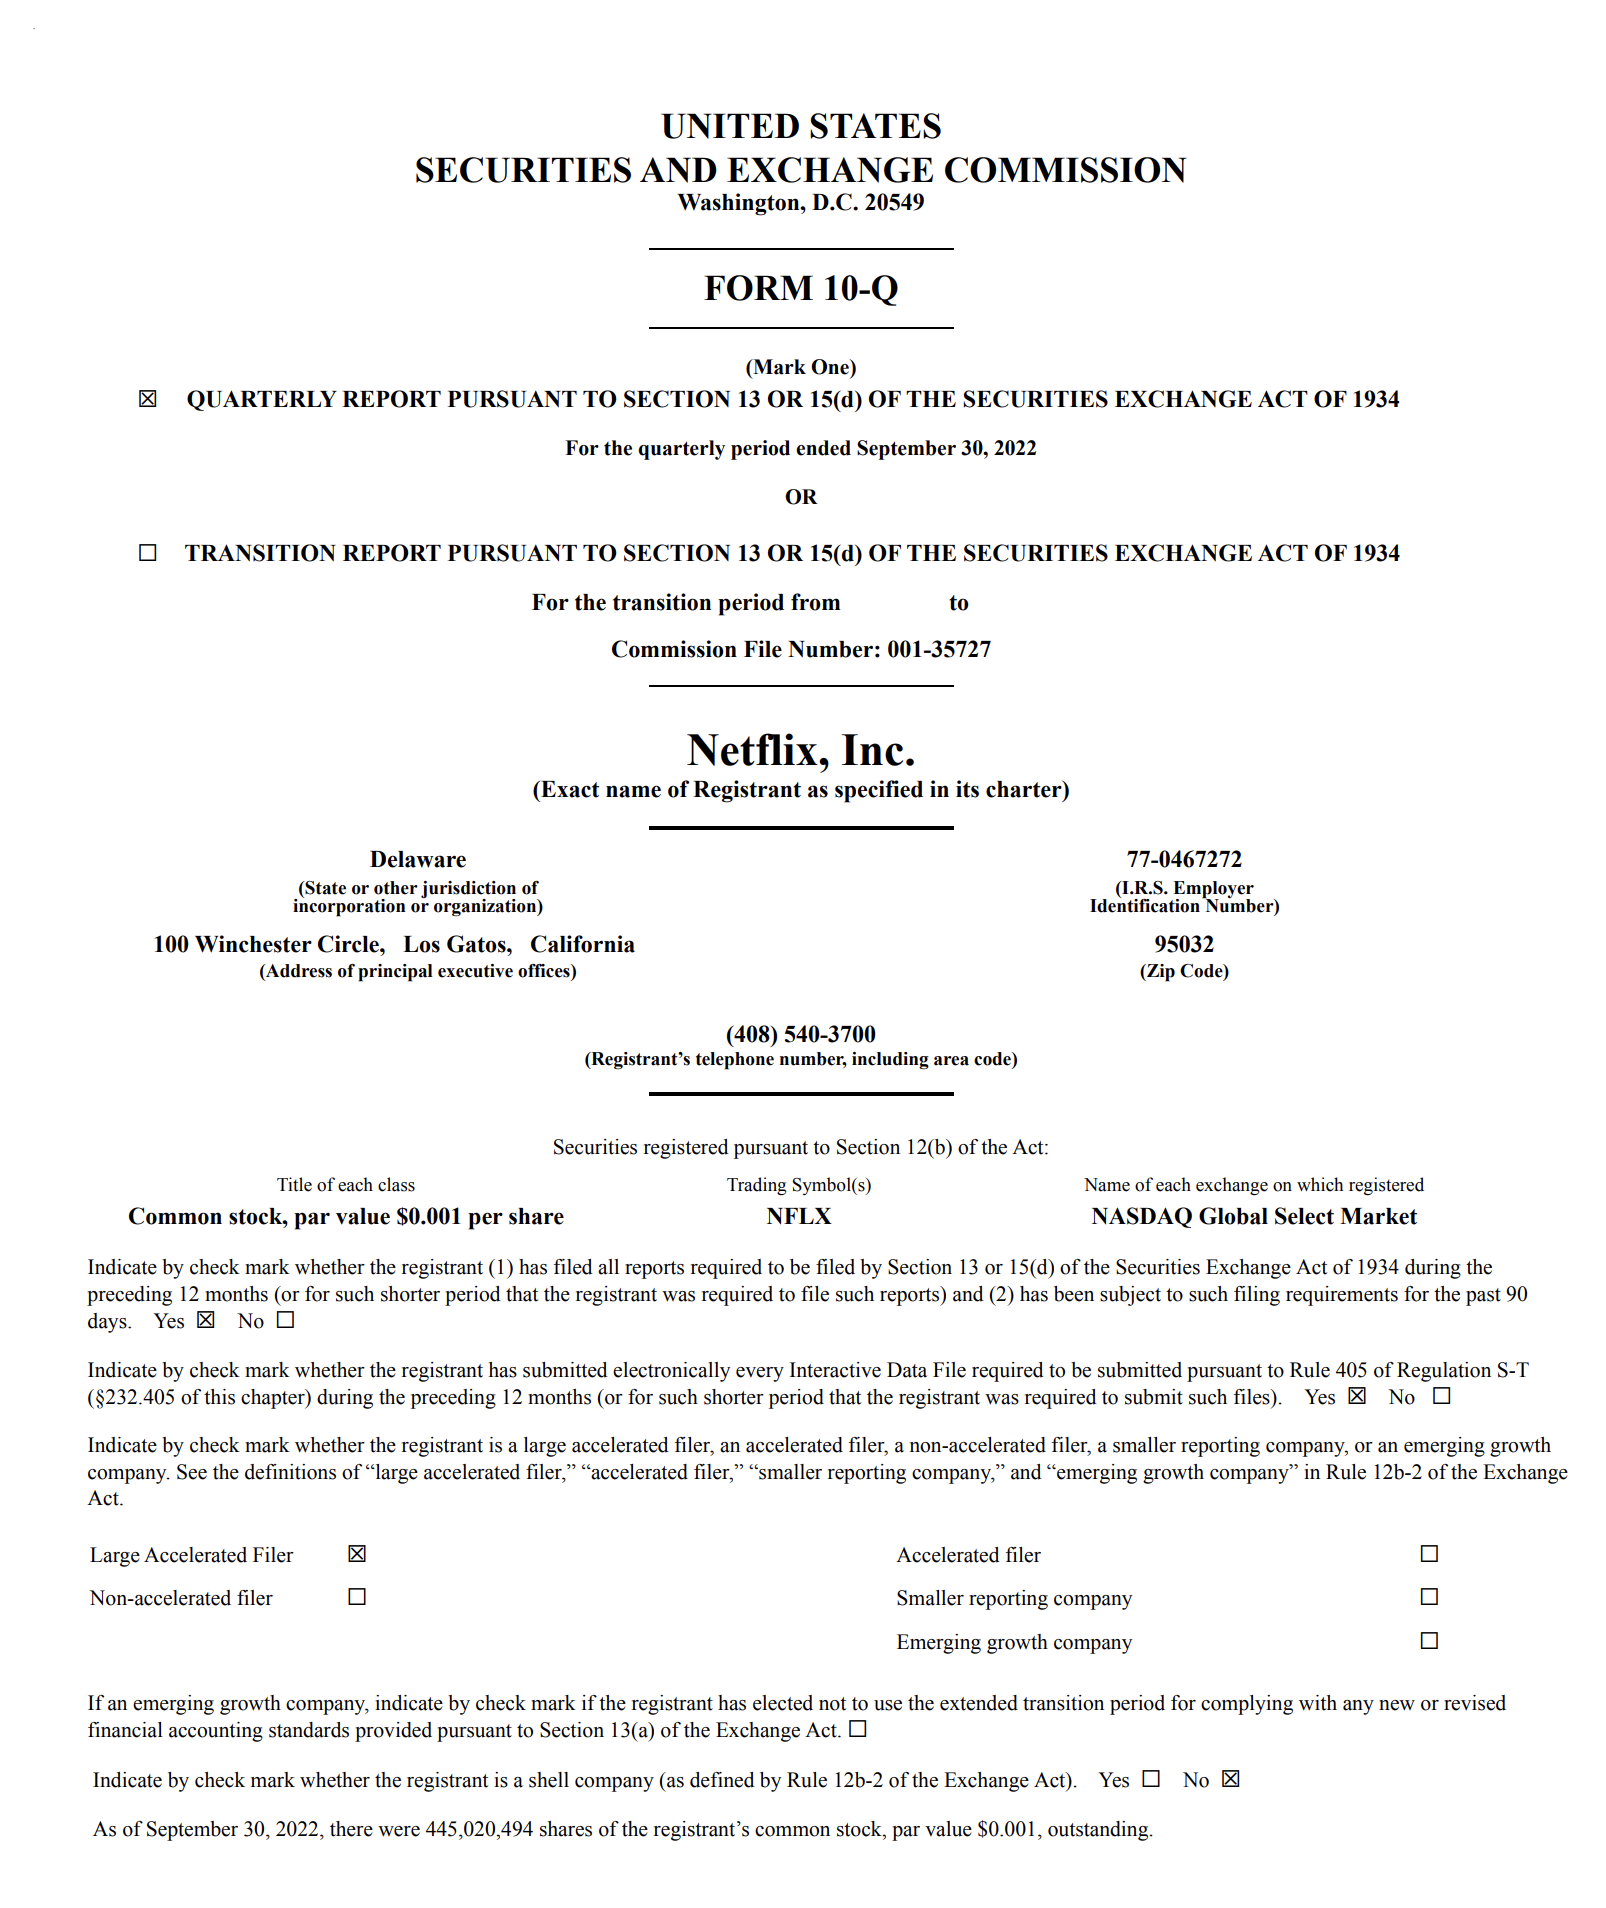
Example of the first 2 pages of a 10-Q from Netflix (Most 10-Qs are shorter and less dense than 10-Ks, typically ranging from 30 to 80 pages, depending on the company and quarter.)
A Form 10-Q is the SEC-mandated quarterly report that gives investors an unaudited, mid-year snapshot of a public company’s operations, risk profile, and financial position. Filed for each of the first three fiscal quarters under Exchange Act Rule 13a-13, it ensures timely, equal-access disclosure between the annual 10-K filings, satisfying Regulation FD and other continuous-reporting rules. Properly parsed and version-controlled 10-Q filings supply a high-frequency, fundamentals-rich layer to a stat-arb stack, capturing narrative tweaks, mid-year accounting shifts, and evolving risk disclosures overlooked by price-only models.
Relevance for predictive modeling
unaudited yet richly narrative; quarter-over-quarter sentiment drift, risk-factor edits, and accrual surprises drive 10- to 20-day post-filing drift. Faster cadence than 10-K makes it more useful for tactical books.
Document anatomy & file formats
| Core Section (SEC Item) | Typical Analytics Value |
|---|---|
| Part I, Item 1 — Financial Statements | Quarterly accruals, segment revenues, off-BS items |
| Item 2 — MD&A | Management tone & outlook; lexical sentiment shift |
| Item 3 — Quant. & Qual. Market-Risk Disclosure | Duration gaps, hedge ratios, VaR narrative |
| Part II, Item 1A — Risk Factors (updates) | New/removed risks signal latent shocks |
| Item 5 — Other Information | Ad-hoc disclosures that miss press-release filters |
Formats:
10-Q filings are delivered by the SEC through EDGAR as raw HTML and inline XBRL. These formats are rich in detail but not immediately model-ready. Data vendors such as S&P Global MRI and FactSet repackage the filings into structured JSON or XML feeds for easier analysis. A typical 10-Q in HTML format is about 150–250 kilobytes. When including inline XBRL, the size increases significantly, and across a full decade of S&P 1500 filings, the compressed archive totals roughly 90 GB.
Latency:
The SEC requires large accelerated filers to submit 10-Qs within 40 days of quarter-end, and 45 days for other registrants. In practice, most firms comply or file slightly early. Once posted on EDGAR, vendor-parsed JSON or XBRL versions—such as those from S&P Global MRI—are typically available within 10 to 30 minutes, as benchmarked in the Q1 2025 cycle. Amended 10-Q/As arrive less predictably, often following restatements, with a median delay of around 6 days after the original filing. Since the market only partially reacts to textual signals in the first hour after release, having ingestion pipelines that operate within that sub-hour window can offer a meaningful edge.
Data Processing Pipeline
This is an overview of what the pipeline could look like as part of a first-draft requirements sheet. Teams should refine based on tech stack and custom needs.
Ingest the Filing
The process begins by detecting new 10-Q filings:Poll the EDGAR RSS feed to catch new filings in real time.
Simultaneously, listen for vendor updates pushed over Kafka.
Every version of a filing is stored to preserve historical integrity, including updates and amendments.
Parse and Clean the Document
Once ingested, the filings are transformed into a usable format:Strip HTML tags from the narrative sections.
Convert inline XBRL content using Arelle into structured Parquet files.
Use a combination of regular expressions and XPath to segment key sections (e.g., Item 2: MD&A, Item 3: Risk Disclosures).
Manual QA (Quality Assurance)
A small percentage of filings are manually reviewed each week:Spot-check 0.25% of documents to verify section splits and ensure no exhibits or tables are missing.
Focus checks on edge cases like filings from smaller or foreign issuers.
NLP and LLM-Based Annotation
Advanced language models are applied to extract insights:Run FinBERT fine-tuned for quarterly filings to score sentence-level sentiment.
Measure risk-factor novelty by computing edit distance between current and prior filings using transformer models.
Assess MD&A readability using Flesch scores.
Generate topic embeddings for clustering and similarity search with BERTopic.
Numeric Data Extraction
Targeted financial data is extracted using contextual parsing:Identify and extract footnotes related to contingent liabilities or share-based compensation expenses using pattern matching and classification.
Store Features for Modeling
All structured outputs are saved as point-in-time features:Snapshots are indexed by
tickerandquarter_end, ready for downstream alpha modeling or compliance use.
Features for Predictive Modeling
-
{
"ticker": "NFLX",
"quarter_end": "2025-03-31",
"filing_metadata": {
"filing_datetime": "2025-05-07T20:03:11-04:00",
"after_hours_flag": true,
"revision_count": 0,
"days_since_prev_10q": 91,
"filing_length_words": 21874,
"edgar_accession_number": "0001065280-25-000111"
},
"financial_statement_metrics": {
"revenue": 9720000000,
"revenue_growth_yoy_pct": 7.5,
"opex_margin_pct": 24.1,
"net_income": 1495000000,
"net_margin_pct": 15.3,
"eps_basic": 3.68,
"eps_diluted": 3.55,
"eps_surprise_pct": 2.9,
"gaap_to_non_gaap_gap_pct": 0.07,
"accruals_pct_assets": 0.037,
"operating_cash_flow": 1350000000,
"free_cash_flow": 987000000,
"total_assets": 49000000000,
"total_liabilities": 27800000000,
"debt_to_equity": 1.21
},
"qualitative_section_features": {
"risk_factor_update_flag": 1,
"risk_factor_novelty_jaccard": 0.29,
"mdna_length_words": 5389,
"mdna_sentiment": -0.11,
"mdna_forward_look_sent_pct": 0.21,
"mdna_readability_flesch": 28.4,
"market_risk_word_pct": 0.012,
"litigation_keywords_count": 7,
"best_estimate_supply_chain_flag": 0,
"mdna_covid_ref_flag": 0,
"known_trends_inflation_flag": 1
},
"footnote_and_disclosure_features": {
"footnote_lease_liab": 1230000000,
"footnote_restructuring_cost": 0,
"footnote_share_based_comp_expense": 245000000,
"footnote_tax_risk_flag": 0,
"footnote_pending_litigation_count": 2
},
"esg_disclosure": {
"esg_section_flag": 1,
"esg_keywords_density": 0.006,
"climate_risk_disclosure_flag": 0
},
"semantic_and_nlp_features": {
"novel_words_ratio": 0.042,
"entity_mentions": {
"executives_named": ["Greg Peters", "Reed Hastings"],
"competitor_names": ["Disney+", "HBO Max"],
"geographic_regions": ["LATAM", "Asia-Pacific"]
},
"topic_weights": {
"subscriptions": 0.38,
"content_spending": 0.27,
"regulatory": 0.10,
"technology": 0.13,
"macroeconomics": 0.12
}
}
}
Field Definitions and Explanations
1. Filing Metadata
filing_datetime: SEC timestamp for modeling timeliness/market reaction.
after_hours_flag: Filed outside market hours; impacts immediate price move.
revision_count: Number of filing amendments; may indicate reporting uncertainty.
days_since_prev_10q: Quarter-to-quarter delta.
filing_length_words: Total word count; proxy for report complexity/disclosure scope.
edgar_accession_number: Unique SEC filing ID (for reproducibility).
2. Financial Statement Metrics
revenue, revenue_growth_yoy_pct: Top-line reporting and growth driver.
opex_margin_pct: Operating leverage signal.
net_income, net_margin_pct: Profitability.
eps_basic, eps_diluted, eps_surprise_pct: Core earnings and delta vs expectations.
gaap_to_non_gaap_gap_pct: Reconciliation magnitude, potential aggressiveness.
accruals_pct_assets: Quality of earnings, future reversals.
operating_cash_flow, free_cash_flow: Cash conversion.
total_assets, total_liabilities, debt_to_equity: Balance sheet risk/leverage.
3. Qualitative Section & Risk Disclosures
risk_factor_update_flag: New/updated risk discussion.
risk_factor_novelty_jaccard: Novelty (Jaccard score) of risk factors.
mdna_length_words: Size of management discussion & analysis.
mdna_sentiment: Polarity (e.g., using FinBERT), cause for forward moves.
mdna_forward_look_sent_pct: % sentences determined “forward-looking”.
mdna_readability_flesch: Complexity of MD&A (Flesch score).
market_risk_word_pct: Market risk density (%).
litigation_keywords_count: Count of legal dispute mentions.
best_estimate_supply_chain_flag: Flag if current/expected supply chain impacts discussed.
mdna_covid_ref_flag: Mentions of COVID-19-related impacts.
known_trends_inflation_flag: Explicit trend statement for inflation headwinds/tailwinds.
4. Footnote & Disclosure Features
footnote_lease_liab: Reported lease liabilities.
footnote_restructuring_cost: Costs flagged as restructuring in footnotes.
footnote_share_based_comp_expense: Share-based comp expense.
footnote_tax_risk_flag: Binary for disclosure of significant tax uncertainties.
footnote_pending_litigation_count: Number of ongoing legal cases disclosed.
5. ESG Disclosures
esg_section_flag: Indicates presence of explicit ESG/Sustainability section.
esg_keywords_density: Frequency of ESG keywords (e.g., “sustainability,” “carbon,” etc.).
climate_risk_disclosure_flag: Indicates climate risk as a reported risk.
6. Semantic & NLP Features
novel_words_ratio: “New” terminology relative to previous filings (signal for big updates/strategy shifts).
entity_mentions:
executives_named: Named C-level management.
competitor_names: Key competitors referenced.
geographic_regions: Markets highlighted for growth or risk.
topic_weights: Document’s NLP topic model weights for major themes (LDA/BERTopic etc.), supports causal and cross-firm/sector analysis
Alpha Hypotheses
These are research-backed ideas suggesting that specific patterns in 10-Q filings can help predict stock returns:
H1: Risk-Factor Updates Are Underpriced
When a company adds or edits risk factors in its 10-Q, markets often fail to fully react right away. These companies tend to underperform by about 0.5% over the next 20 trading days.
▸ SSRN Study – Risk Factor Update UnderreactionH2: MD&A Tone Decline Signals Weakness
A noticeable drop in sentiment in the Management Discussion & Analysis section (MD&A) compared to the prior quarter is often followed by weak stock performance the next month. While the signal isn’t highly predictive on its own, it shows directional value across large datasets.
▸ SSRN Study – MD&A Sentiment in 10-QsH3: Language Consistency Pays Off
Firms that reuse similar language quarter-over-quarter tend to outperform those that make major textual changes. The idea is: “same is good, change is bad.” Morgan Stanley research shows a Sharpe ratio of 0.74 from this risk-factor consistency strategy.
▸ FT Coverage – Risk Factor Consistency
Risks and Mitigation
When using 10-Q text and structure for predictive modeling, there are several common pitfalls—and ways to address them:
Boilerplate Language Overload
Generic ESG or cybersecurity sections can dilute true signals of change or novelty.
▸ Fix: Use TF-IDF scoring to reduce the influence of commonly used boilerplate terms relative to the sector.XBRL Tag Inconsistency
The inline-XBRL taxonomy evolves, with new GAAP tags introduced each year. This disrupts numeric feature continuity.
▸ Fix: Maintain a dynamic mapping system that anchors each tag to a parent GAAP category.Quarter Mismatch from Fiscal Drift
Companies that shift fiscal-year boundaries make quarter-over-quarter comparisons tricky.
▸ Fix: Align all records to a fiscal-calendar lookup and assign a stable quarter ID for modeling.Late Filings and NT-10Q Notices
Some companies file late or request extensions (NT-10Q), which interrupts model schedules.
▸ Fix: Use filing delay as a feature and back-fill values using the most recent available data to maintain continuity.Partial Auditor Review
Since 10-Qs are typically unaudited, they carry a higher chance of later restatements.
▸ Fix: Track “Big R” restatements and downweight features until the numbers are confirmed in the audited 10-K.Alpha Crowding
Risk-factor change models are becoming popular among hedge funds and quant teams.
▸ Fix: Combine with alternative features like textual complexity, GAAP-to-non-GAAP reconciliation gaps, or accrual accounting anomalies.