10-K (Annual Report, SEC Filing)
🎯 This data dump is based on my personal research while at BNY.
Data Overview
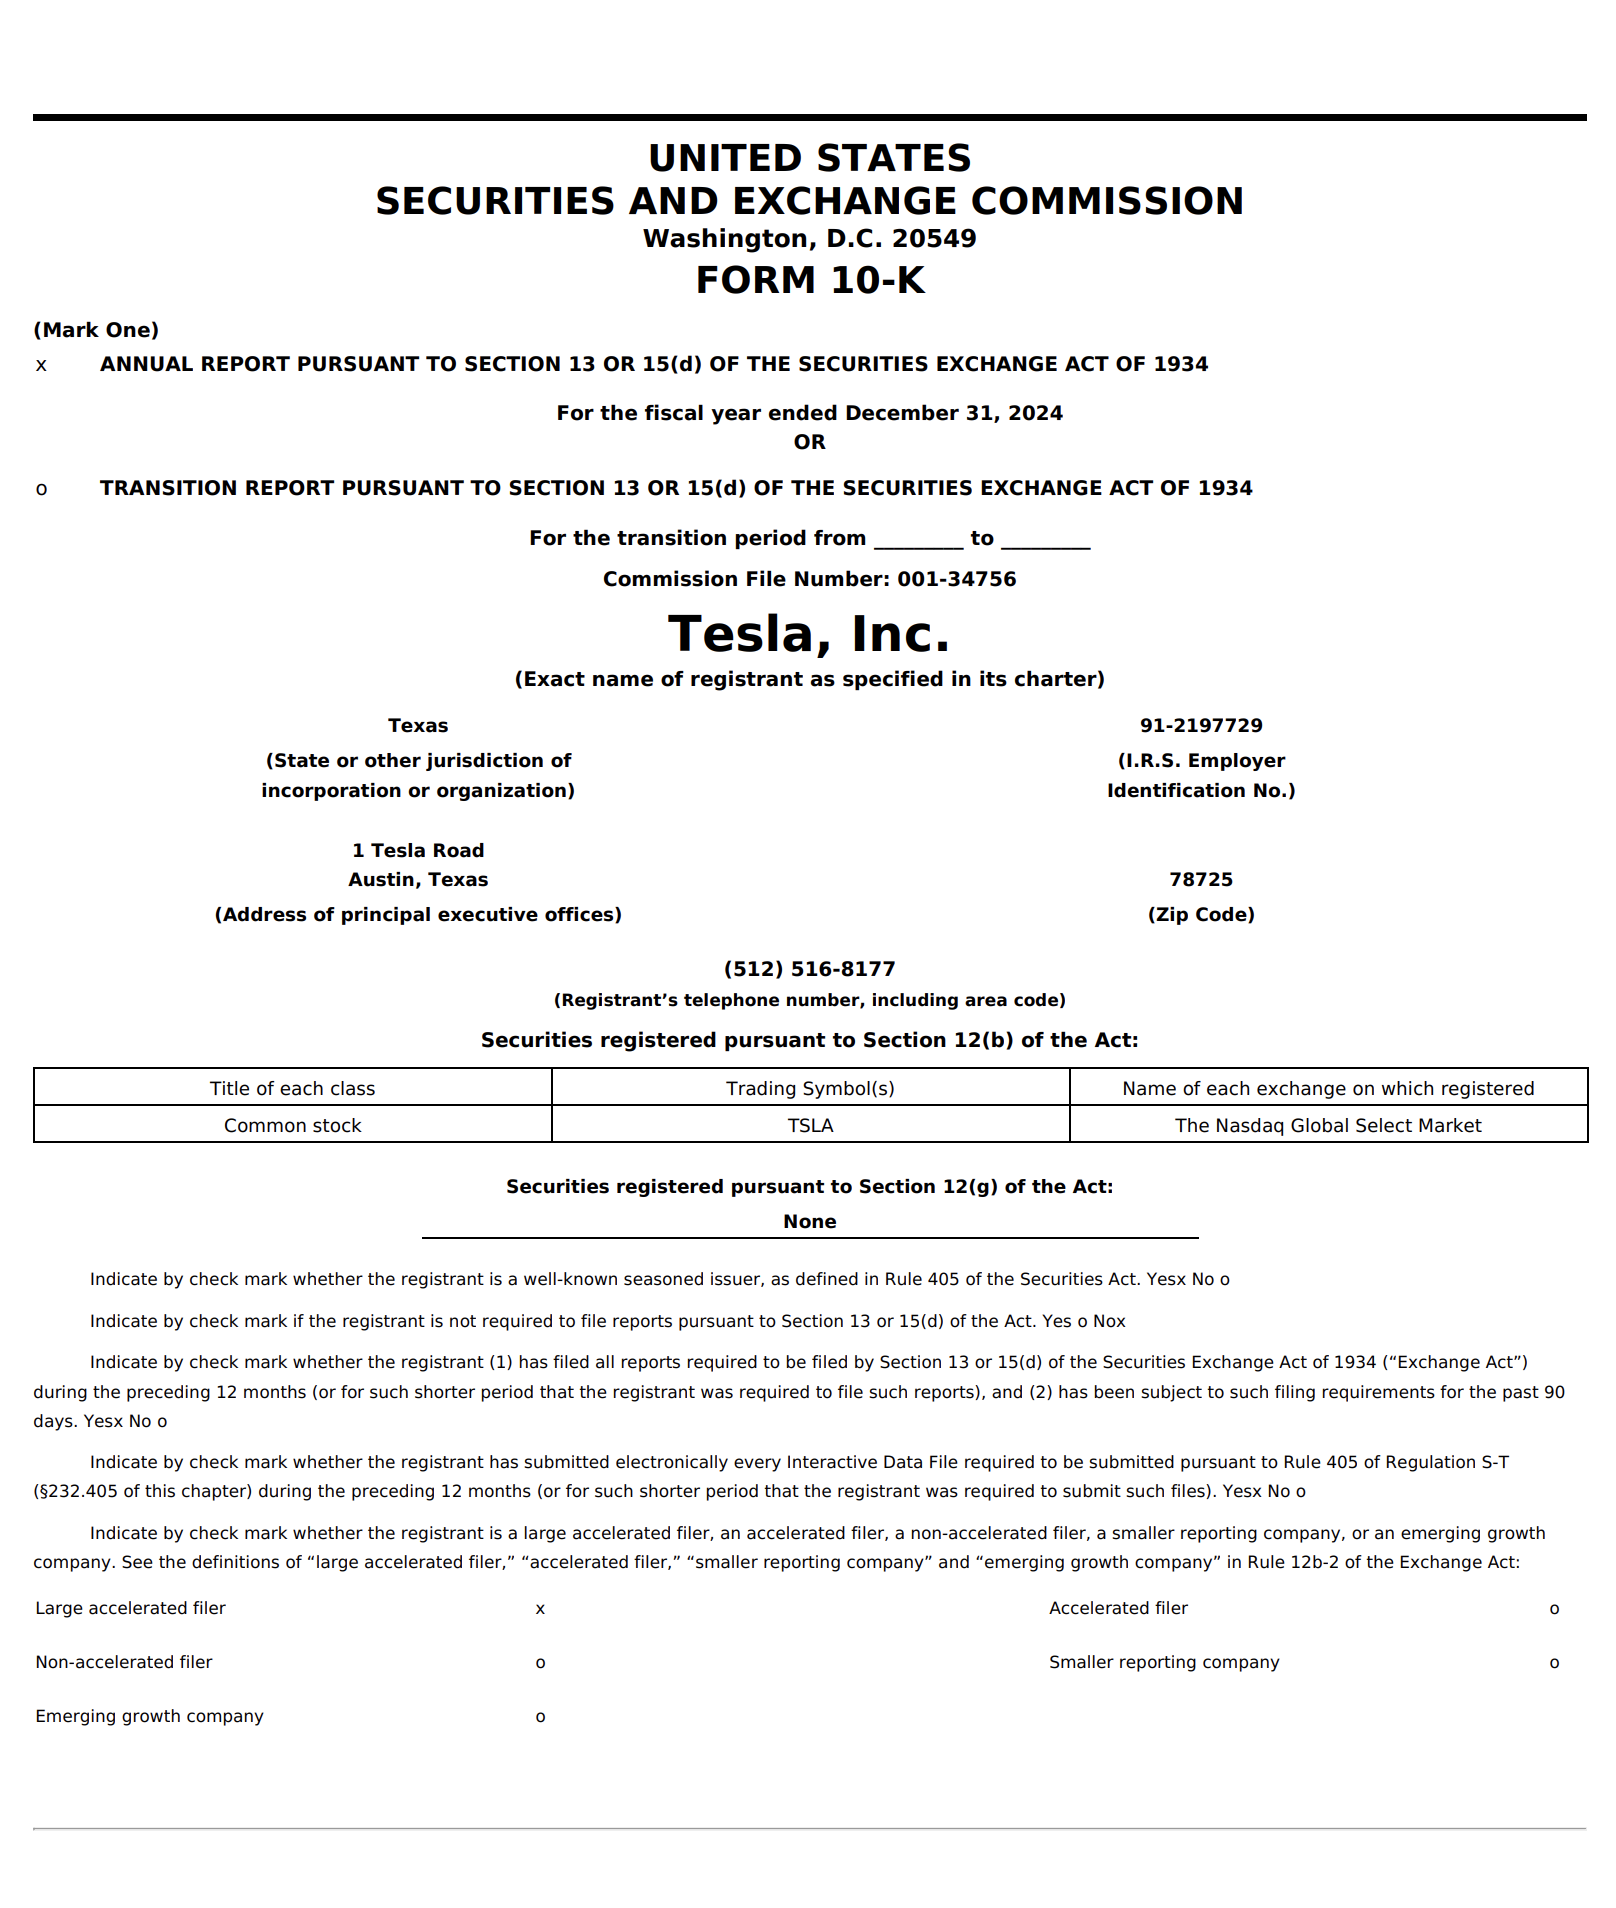
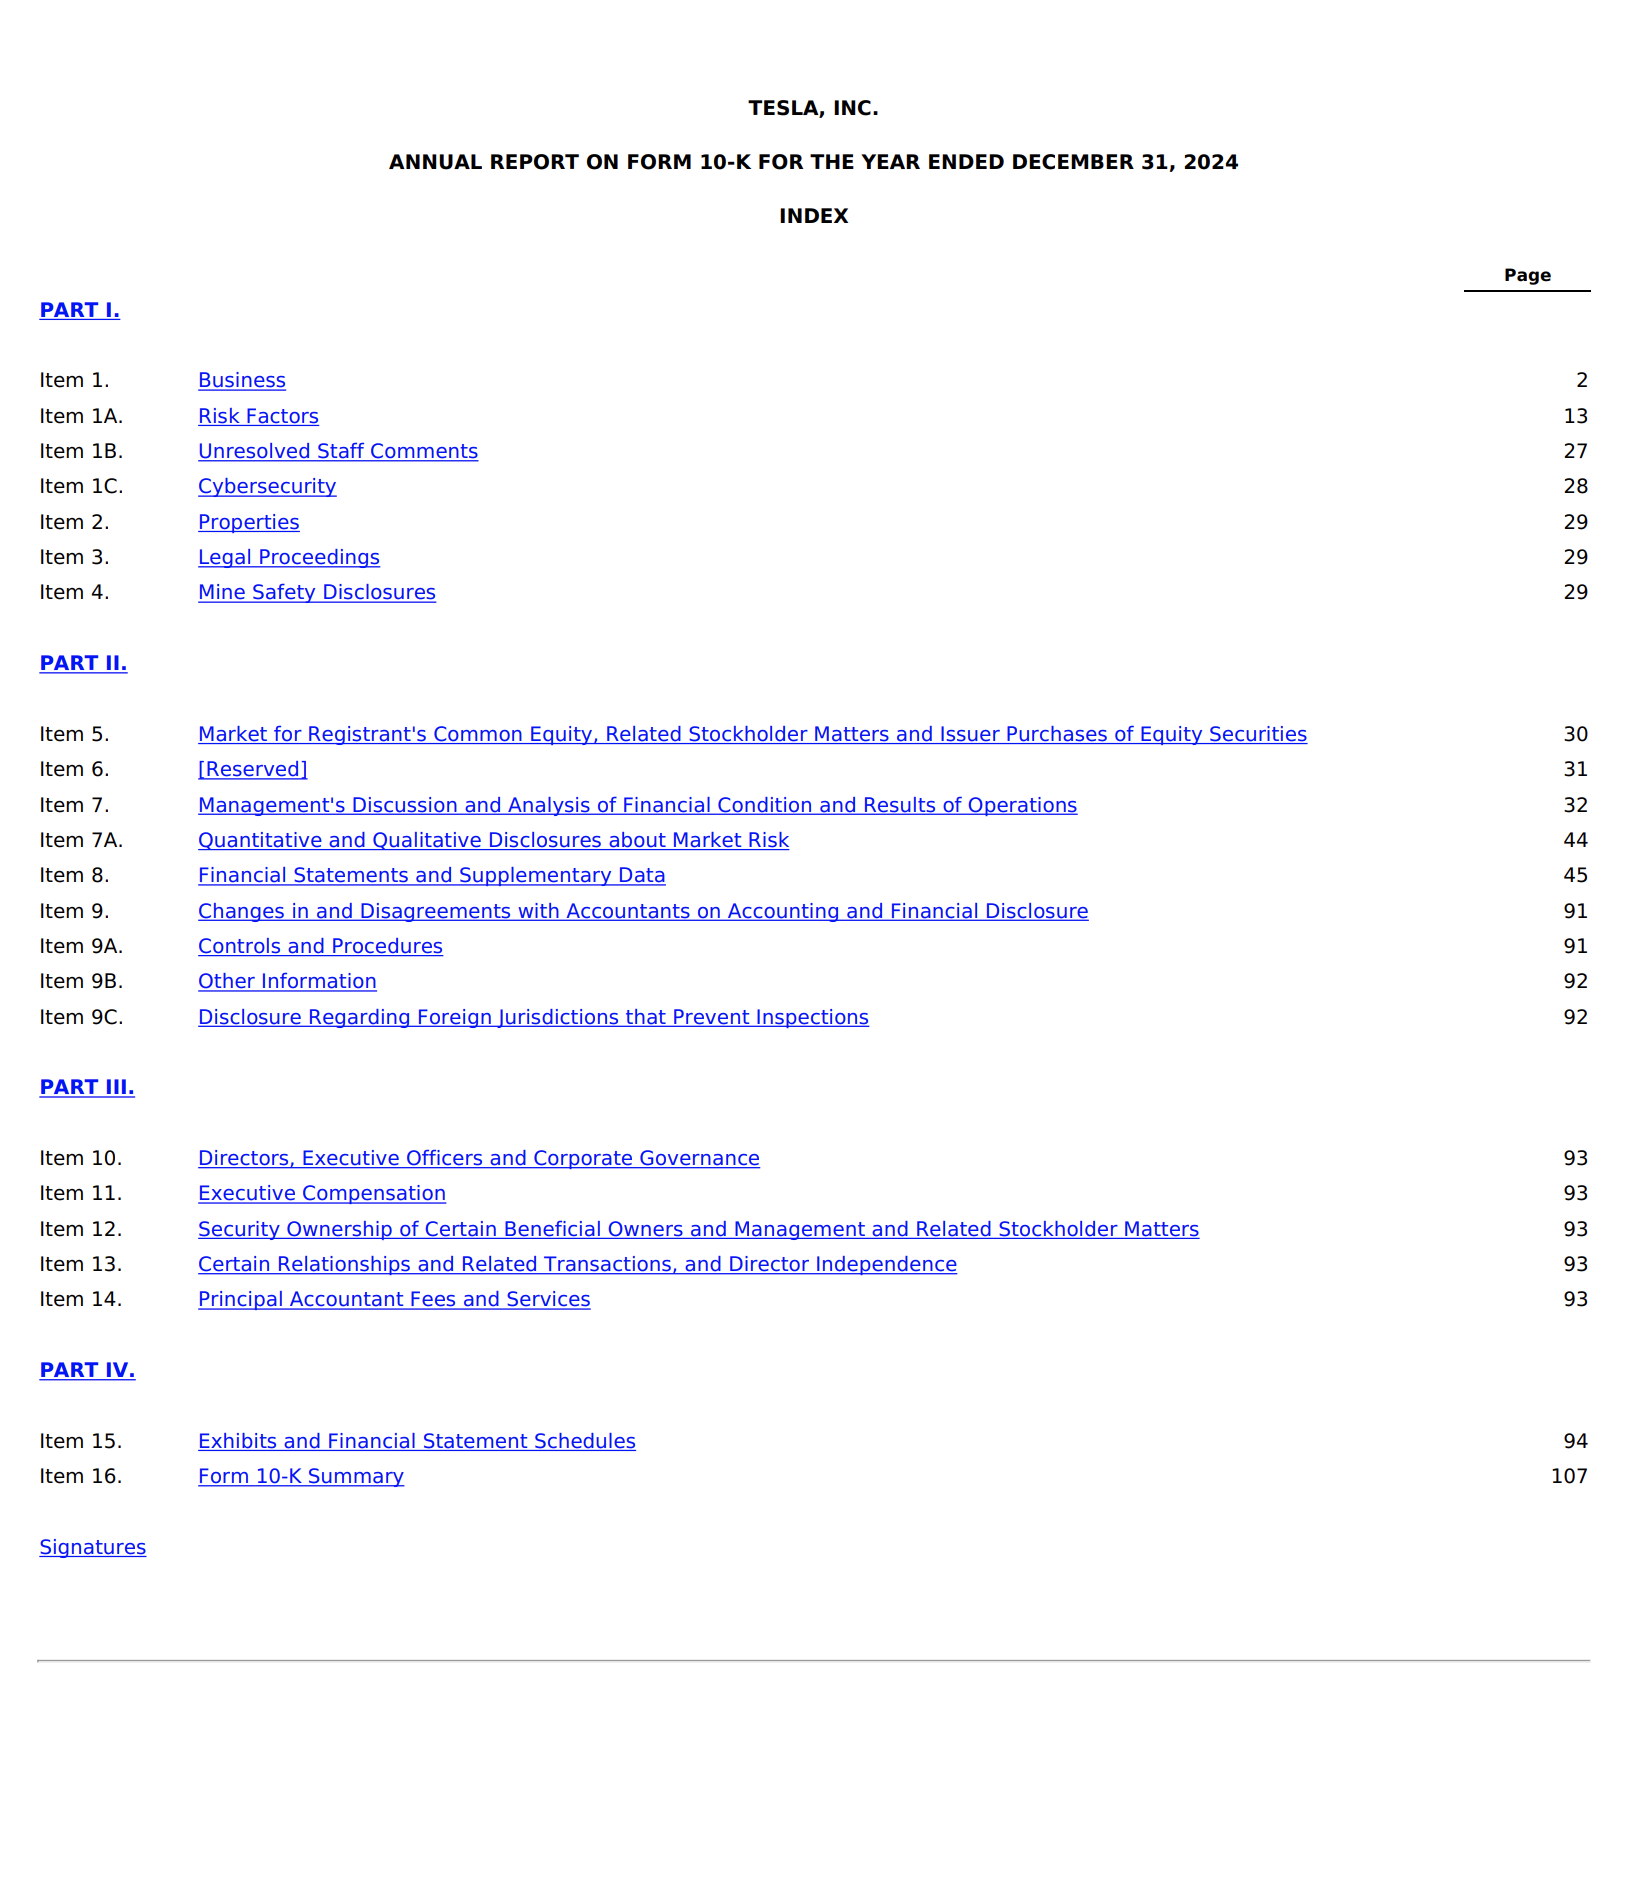
Example of the first 2 pages of a 10-K (Typical 10-Ks range from 80 to 300 pages, depending on the company’s size, complexity, and disclosure requirements.)
A Form 10-K is the U.S. Securities & Exchange Commission’s (SEC) legally-mandated annual report in which every public issuer must provide a comprehensive, audited account of its business, financial condition, risk profile and governance for the just-ended fiscal year. Required under the Securities Exchange Act of 1934, the 10-K complements, but is far more detailed than, the glossy shareholder report, ensuring all market participants have equal-access, decision-critical information and satisfying Regulation FD’s fair-disclosure regime. Properly parsed, version-controlled 10-K disclosures offer a slow-moving yet powerful fundamental overlay to a fast-paced stat-arb stack, capturing narrative shifts, hidden liabilities and management tone that price-only models miss.
Relevance for predictive modeling
Inline-XBRL financial statements inside are machine-readable fundamentals with no vendor lag. Ratio surprises (working-capital accruals, leverage, segment revenue volatility) help orthogonalise price-momentum factors.
Document anatomy & formats
| Core Section (SEC Item) | Typical Analytics Value |
|---|---|
| Item 1 – Business | Narrative on segments, customers, suppliers, competition |
| Item 1A – Risk Factors | Forward-looking risk disclosure; language shifts predict future under-performance |
| Item 7 – MD&A | Management’s colour on results & outlook; lexical tone foreshadows guidance bias |
| Financials (F-statements & notes) | Accruals, footnote contingencies, off-balance sheet items |
| Exhibits | Debt covenants, material contracts, ESG data |
Formats:
EDGAR delivers filings as raw HTML and inline XBRL. Vendors like Capital IQ and PrivCo republish them as structured JSON or XML feeds. A complete archive of S&P 1500 10-K filings over the past 25 years is approximately 120 GB in compressed text. When parsed into tabular form using inline XBRL, the data volume roughly triples.
Latency:
SEC rules require large accelerated filers to submit 10-Ks within 60 days of fiscal year-end, and 90 days for accelerated filers. Most companies file earlier—the median lag is about 47 days. In cases where firms file late, NT-10K filings show the median delay is around 15 days. Amended filings (10-K/A) may arrive later, but usually appear sporadically and without systematic timing.
Data Processing Pipeline
This is an overview of what the pipeline could look like as part of a first-draft requirements sheet. Teams should refine based on tech stack and custom needs.
Ingest
The pipeline starts by gathering data from multiple sources:Regularly polls the EDGAR RSS feed for new filings.
Listens to vendor pushes via Kafka.
Uses checksums to remove duplicate documents across sources.
Parsing
Next, the raw filings are parsed into structured formats:HTML filings are processed using BeautifulSoup.
Inline XBRL sections are parsed with Arelle and converted into Parquet format.
Sections are identified and split using regular expressions (e.g., detecting headers like “Item 1A.”).
Cleaning
The narrative content is cleaned and normalized:Strips tables from narrative sections.
Removes remaining HTML tags.
Standardizes all Unicode characters for consistency.
Manual QA (Quality Assurance)
Human reviewers inspect a small sample weekly:0.25% of filings are spot-checked to ensure accurate section splitting.
NLP/LLM Annotation
Several layers of text analysis are applied:Sentence-level sentiment analysis using FinBERT.
Risk factor detection using a SciBERT model fine-tuned on “Item 1A” disclosures.
Year-over-year text comparison using transformer-based edit distance.
Topic modeling and embeddings with BERTopic.
Numeric Extraction
Financial footnotes and values are programmatically extracted:Footnote content is scanned using regex.
Contextual classifiers determine the category (e.g., pension obligations, lease liabilities).
Feature Store Update
Finally, all structured outputs are saved:A point-in-time snapshot is stored, keyed by
(ticker, fye_date)for use in downstream models.
Features for Predictive Modeling
-
{
"ticker": "TSLA",
"fye_date": "2023-12-31",
"meta": {
"filing_datetime": "2024-02-28T19:56:14-05:00",
"after_hours_flag": true,
"edgar_accession_number": "0001318605-25-000015",
"revision_count": 0,
"filing_length_words": 67580,
"word_count_by_section": {
"risk_factors": 12754,
"mdna": 9460,
"business": 6138,
"financial_statements": 22488,
"legal_proceedings": 1862,
"esg_section": 225
}
},
"risk_disclosure": {
"risk_factor_novelty_jaccard": 0.34,
"risk_factor_update_flag": 1,
"risk_factor_sentiment": -0.14,
"risk_factor_length_words": 12754,
"emerging_risk_keywords": 6,
"cybersecurity_mentions": 12,
"climate_risk_mentions": 3,
"litigation_word_pct": 0.021
},
"mdna_section": {
"mdna_positive_tone": -0.08,
"mdna_forward_looking_pct": 0.17,
"mdna_sentiment_zscore_vs_sector": -0.9,
"mdna_readability_flesch": 26.1,
"mdna_novelty_cosine": 0.22,
"mdna_length_words": 9460
},
"financial_statement_metrics": {
"revenue": 123980000000,
"revenue_growth_yoy_pct": 14.3,
"cost_of_revenue": 79860000000,
"gross_margin_pct": 35.6,
"operating_income": 15780000000,
"net_income": 9982000000,
"ebitda": 17450000000,
"eps_basic": 3.82,
"eps_diluted": 3.64,
"cash_and_equivalents": 22000000000,
"total_assets": 91600000000,
"total_liabilities": 62000000000,
"total_equity": 29600000000,
"operating_cash_flow": 12240000000,
"free_cash_flow": 8640000000,
"debt_to_equity": 1.47
},
"footnotes_and_contingencies": {
"footnote_contingent_liab": 2400000000,
"footnote_lease_obligations": 787000000,
"footnote_pending_litigation_count": 5,
"footnote_tax_risk_flag": 1,
"off_balance_sheet_flag": 0
},
"esg_and_other_qualitative": {
"esg_section_flag": 1,
"esg_keyword_density": 0.015,
"climate_disclosure_flag": 1,
"esg_novelty_jaccard": 0.18,
"supply_chain_word_pct": 0.004
},
"semantic_nlp_features": {
"novel_words_ratio": 0.036,
"named_entity_mentions": {
"ceo_names": ["Elon Musk"],
"subsidiaries": ["Tesla Energy", "Tesla Finance"],
"major_partners": ["Panasonic", "CATL"],
"geographic_expansions": ["Giga Berlin", "Giga Mexico"]
},
"section_topic_weights": {
"ai_autonomy": 0.22,
"battery_tech": 0.11,
"manufacturing_expansion": 0.16,
"regulatory": 0.09,
"macroeconomics": 0.07,
"cybersecurity_privacy": 0.02
}
},
"visual_and_presentation_features": {
"table_count": 43,
"chart_count": 17,
"infographic_flag": 1
}
}
Field Definitions and Explanations
1. Meta & Filing Structure (meta)
filing_datetime: SEC filing time for market reaction modeling.
after_hours_flag: After/before market filing.
edgar_accession_number: Unique SEC filing ID.
revision_count: Number of amendments on EDGAR.
filing_length_words: Total word count.
word_count_by_section: Word counts for key items (Risk, MD&A, Business, Legal, ESG).
2. Risk Disclosures (risk_disclosure)
risk_factor_novelty_jaccard: Jaccard similarity (new vs. prior year) measuring novelty.
risk_factor_update_flag: Indicates new/modified risks disclosed.
risk_factor_sentiment: Sentiment polarity of risk factors (NLP).
risk_factor_length_words: Sectional length.
emerging_risk_keywords: Mentions of new/emerging risk types (e.g., "AI", "geopolitics").
cybersecurity_mentions: Keyword density/count.
climate_risk_mentions: Specific mentions of climate risk/regulation.
litigation_word_pct: % of legal wording in relevant sections.
3. MD&A Analytics (mdna_section)
mdna_positive_tone: Sentiment/NLP score (overall tone, e.g., FinBERT).
mdna_forward_looking_pct: % of text flagged as forward-looking.
mdna_sentiment_zscore_vs_sector: Tone anomaly vs. sector norm.
mdna_readability_flesch: Flesch readability (interpretive difficulty).
mdna_novelty_cosine: Surprise/novelty vs. prior MD&A.
mdna_length_words: Section length.
4. Financial Statement Metrics (financial_statement_metrics)
revenue, revenue_growth_yoy_pct: Total revenue, YoY change.
cost_of_revenue, gross_margin_pct: COGS and profitability profile.
operating_income, net_income, ebitda: Core income measures.
eps_basic, eps_diluted: Earnings per share.
cash_and_equivalents, total_assets, total_liabilities, total_equity: Balance sheet snapshot.
operating_cash_flow, free_cash_flow: Liquidity/health.
debt_to_equity: Leverage.
5. Footnotes & Contingencies (footnotes_and_contingencies)
footnote_contingent_liab: $ value of contingent liabilities.
footnote_lease_obligations: Lease note exposure.
footnote_pending_litigation_count: Pending legal cases disclosed.
footnote_tax_risk_flag: Major tax risk flagged.
off_balance_sheet_flag: Indicates any off-BS arrangements.
6. ESG & Qualitative Disclosures (esg_and_other_qualitative)
esg_section_flag: Explicit presence of ESG section.
esg_keyword_density: Density of ESG-related keywords.
climate_disclosure_flag: Binary—material climate disclosures.
esg_novelty_jaccard: Change/novelty in ESG content.
supply_chain_word_pct: Proportion of supply chain discussion.
7. Semantic NLP Features (semantic_nlp_features)
novel_words_ratio: Proportion of novel vocabulary/phrases.
named_entity_mentions: Key management, subsidiaries, partners, new markets.
section_topic_weights: Topic modeling weights (e.g., "ai_autonomy", "manufacturing_expansion").
8. Visual & Presentation (visual_and_presentation_features)
table_count: Number of tables in filing.
chart_count: Number of figures/charts.
infographic_flag: If infographics are present—which are associated with increased volatility and attention
Alpha Hypotheses
These are theories about how specific patterns in 10-Ks can help predict future stock returns:
H1: Risk-Factor Novelty Premium
When a company makes very few changes to the "Risk Factors" section (Item 1A) from year to year, it tends to perform better. If the language stays the same, it's a sign of stability. Large edits, on the other hand, may signal new risks.
▸ Morgan Stanley’s study showed that a portfolio that goes long on "low-change" firms and short on "high-change" ones had a Sharpe ratio of 0.59.H2: Tone Drift in MD&A
If the tone in the "Management Discussion & Analysis" section (Item 7) becomes more negative compared to the prior year, the stock often underperforms.
▸ Backtests using the Loughran-McDonald sentiment dictionary found a −1.2% abnormal return in the following month when sentiment declined.H3: Litigation Mentions and Risk
A higher number of legal terms like “class action,” “FTC,” or “EPA” in Item 3 (“Legal Proceedings”) suggests the company may be facing serious regulatory or legal threats.
▸ Research from Berkeley shows the market tends to underreact to this, but implied volatility increases and stocks often fall the following quarter.H4: Complex Language Signals Risk
Companies that write in overly complex or dense language (as measured by readability scores) tend to have more future accounting misstatements. Investors often miss these red flags.
▸ Studies from 2010 to 2024, including recent work using LLM sentiment analysis, show that harder-to-read filings often lead to mispriced stocks.
Risks and Mitigation
Here are key risks when using 10-Ks for alpha generation and how to deal with them:
Boilerplate Language and ESG Marketing Bloat
Overuse of generic language and marketing terms (especially around ESG) can dilute the value of sentiment signals.
▸ Mitigation: Focus analysis on specific sections (e.g., Item 1A only), and use TF-IDF weighting to reduce the influence of overused words in each sector.Inconsistent Reporting Across Companies
Smaller or foreign companies may use different formats (like 20-F instead of 10-K), with different item numbers.
▸ Mitigation: Map all filings to a standard schema, and use models that adapt to language variations.Delayed Filings or NT-10K Notices
If a company files late or submits an NT-10K extension, it can be a warning sign, but also causes gaps in time-series data.
▸ Mitigation: Treat delay as a feature, and freeze each document version at the time it was available.Changing XBRL Tags
GAAP standards evolve yearly, introducing new tags and changing how data is reported.
▸ Mitigation: Use a dynamic mapping table and tie numeric features to higher-level US-GAAP elements to keep continuity.Regulation Fair Disclosure (Reg FD) Compliance
You can't redistribute full-text filings directly due to legal restrictions.
▸ Mitigation: Hash and store the original text securely, and only share derived metrics with end users.Alpha Crowding from Other Quants
Some of these signals, like tracking risk-factor changes, are already used by sell-side quant desks.
▸ Mitigation: Combine with less common features like text complexity, contingent liability detection, or spikes in cybersecurity-related keywords.