Startup Pitch Deck
🎯 This data dump is based on my startup evaluation project with Bosch at CMU. The objective is to find features relevant for investment analysis.
Data Overview
Selection of 3 pages of Uber’s seed pitch deck
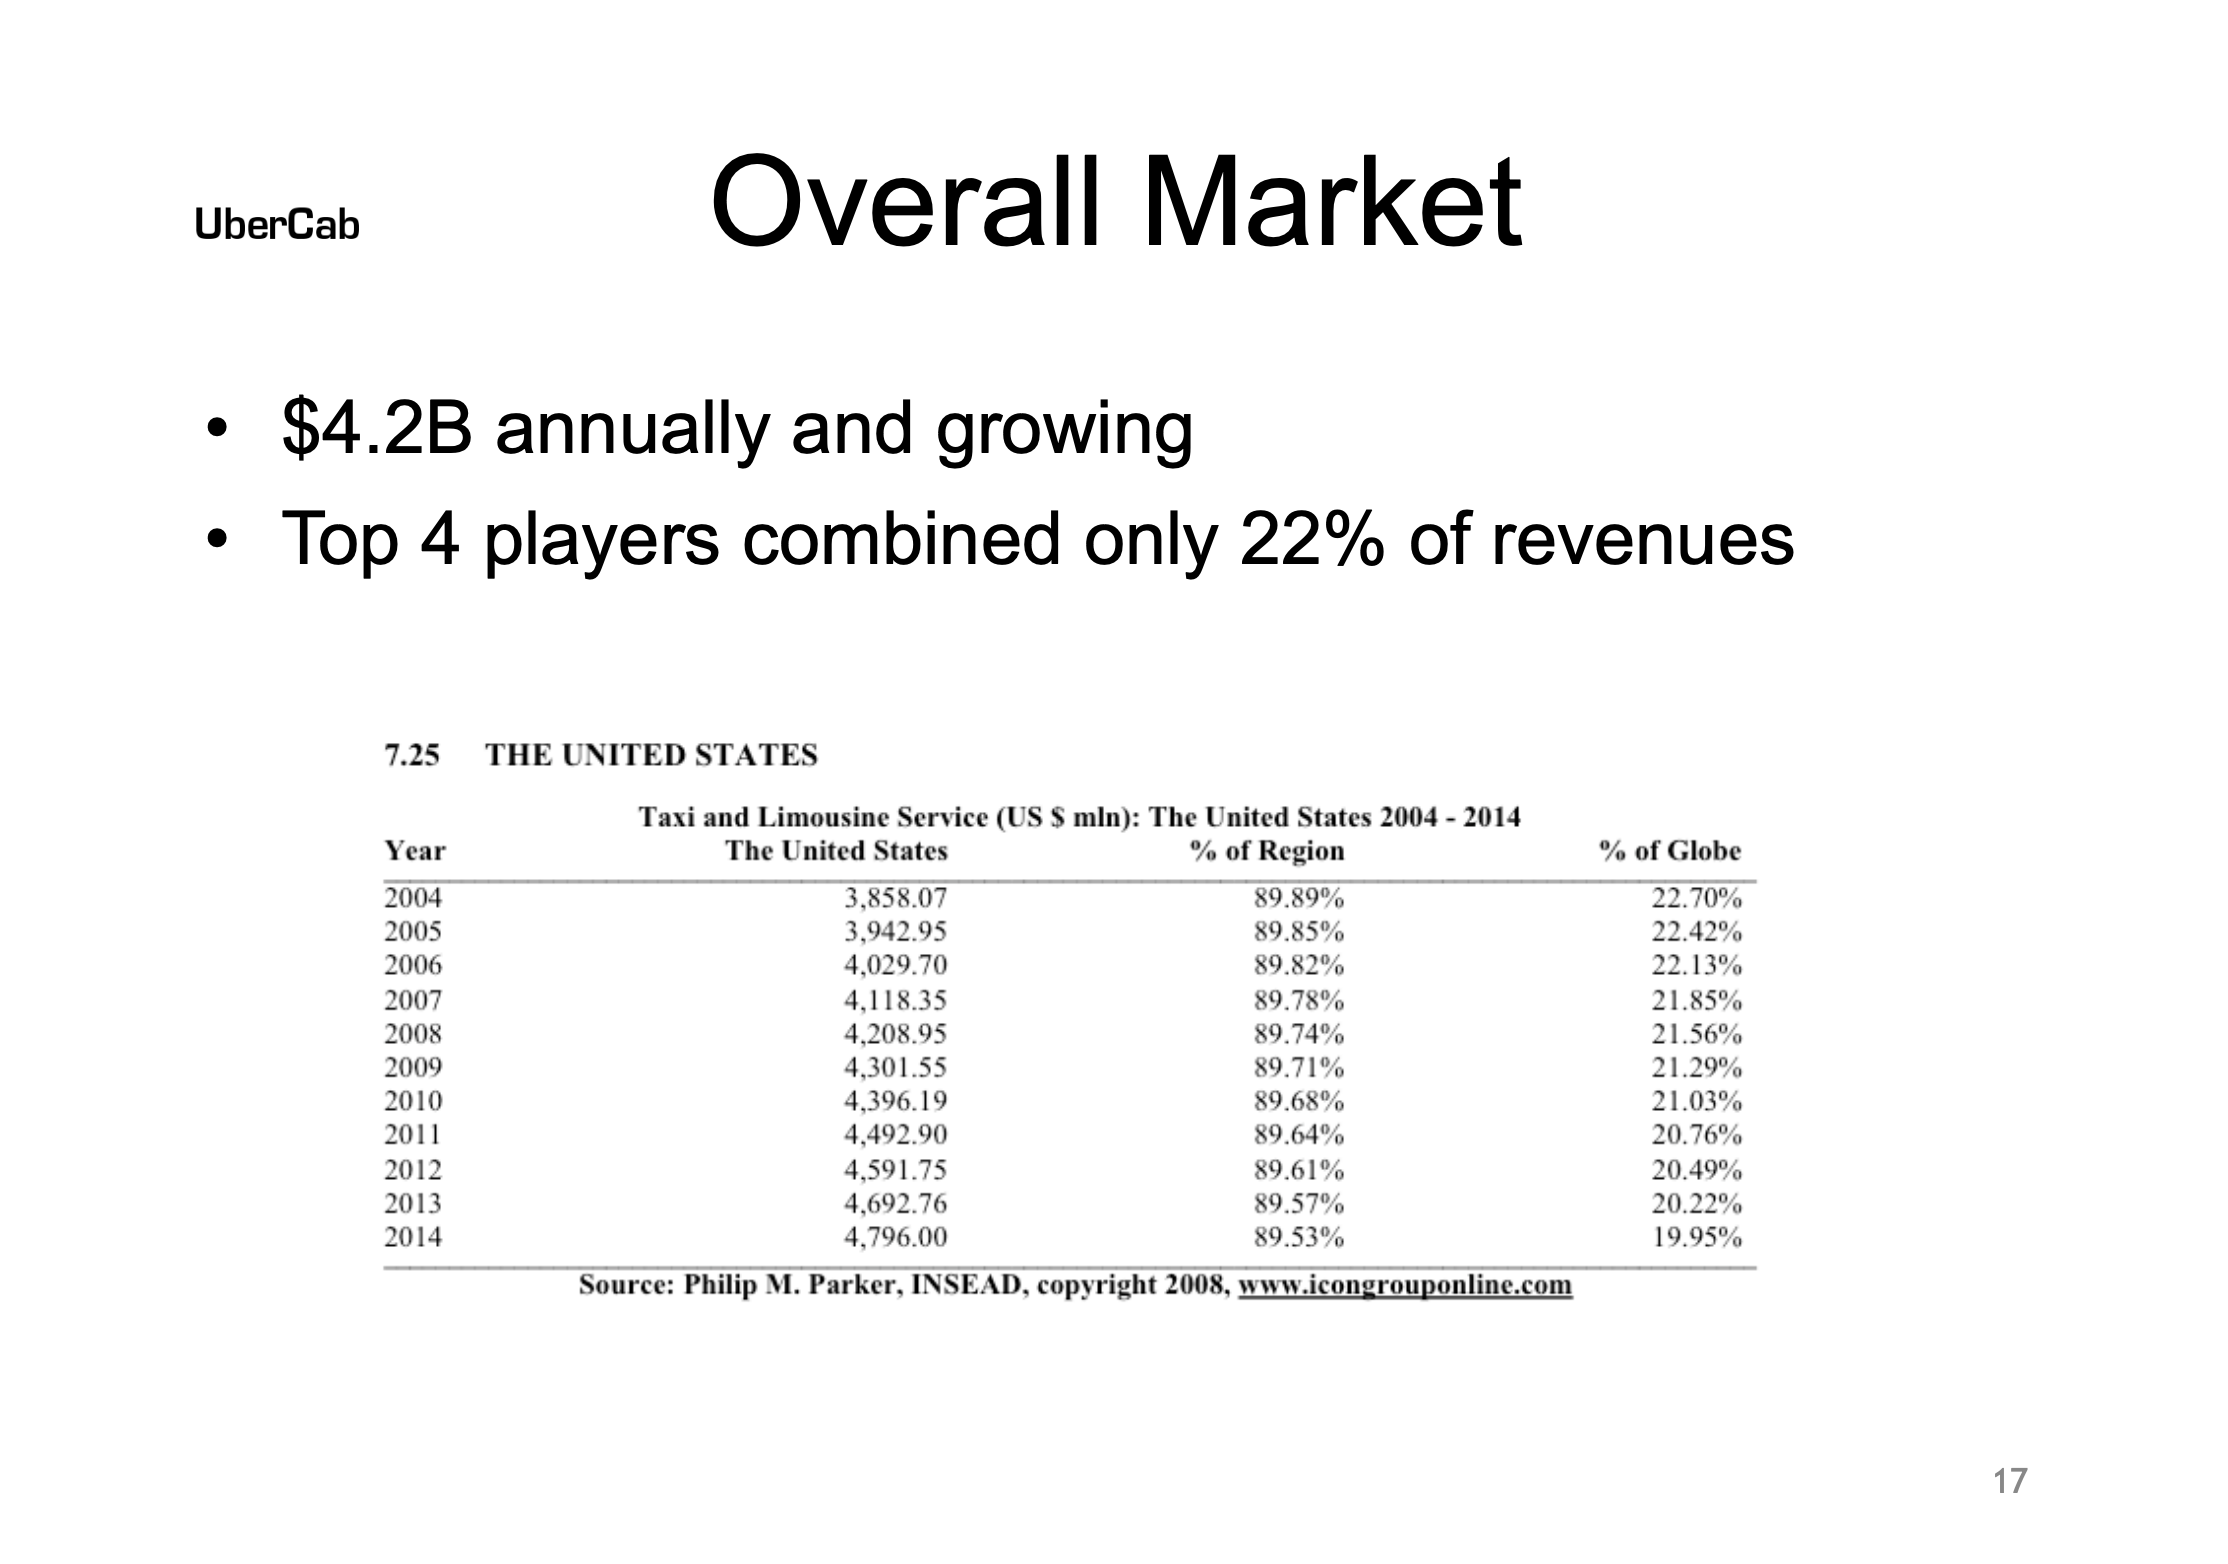
A startup pitch deck is a slide-based narrative founders assemble to persuade investors to fund an early-stage venture. Because it must communicate market opportunity, technical edge, team calibre and financial upside in minutes, the deck condenses a vast amount of qualitative and quantitative information, everything from total addressable market (TAM) to product road-map, as seen in Uber’s 2008 seed deck, which lays out concept, technology and a “$4.2 B annually and growing” market snapshot.
What arrives and how it is structured
Typical formats are PDF, Google Slides or PowerPoint; each slide is effectively a semi-structured JSON object containing a title, bullet text, images and sometimes a table or chart figure.
Core sections recur across decks:
Market Potential (TAM, CAGR, validation, traction, competition)
Technical Feasibility (technology readiness level, IP portfolio, scalability, risk)
Business Model Viability (pricing, acquisition cost, unit economics)
Team Experience (bios, skills, coachability)
Strategic Fit (partnerships, ESG or sustainability claims).
File sizes range from 1 MB for seed rounds to 20 MB for late-stage. Founders share them via email or data rooms, so latency is “batch”, we obtain them only when diligence starts or founders circulate investor updates, normally hours to days after creation, not real-time.
Data Processing Pipeline
Ingest: pull PDFs from founder emails or virtual data rooms; version and store raw bytes in object storage.
OCR & layout parsing: run Tesseract + pdfplumber to isolate text boxes, images and tables; export to Slide-level JSON.
Section classification: fine-tuned LLM tags each slide into one of the five meta-categories above.
Entity & metric extraction: regex plus an LLM with in-context examples grabs numbers (e.g., “TAM: $4.2 B”), traction metrics, IP counts, team names.
Sentiment & narrative signals: FinBERT on bullet lines; a startup-domain RoBERTa model classifies risk language (“regulatory”, “hardware delays”).
Manual validation: analyst verifies numeric fields with >5 % confidence delta or that fail consistency checks (e.g., head-count < founders listed).
Feature store write: point-in-time artefacts keyed by (
company_id,deck_version_date) and propagated to the private-investment model warehouse.
Data to Extract
-
{
"company_id": "UBER-2008",
"deck_version_date": "2008-08-20",
"market_opportunity": {
"tam_usd_billion": 4.2, // Total Addressable Market
"sam_usd_billion": 1.2, // Serviceable Available Market
"som_usd_billion": 0.38, // Serviceable Obtainable Market
"market_growth_rate_cagr_pct": 12.0, // CAGR for TAM (%)
"market_trend_description": "Urban mobility shift, ride-hailing adoption"
},
"business_traction": {
"traction_metric_label": "paying_clients",
"traction_metric_value": 15,
"annual_revenue_usd": 90000,
"mrr_usd": 3500,
"active_users": 480,
"monthly_user_growth_pct": 21.0,
"customer_retention_pct": 88.0,
"churn_rate_pct": 8.0,
"customer_lifetime_value_usd": 280,
"customer_acquisition_cost_usd": 44,
"pilot_partnerships": 2
},
"technology_product": {
"tech_readiness_level": 4,
"product_stage": "beta",
"unique_value_proposition": "On-demand rides by mobile app",
"patent_app_count": 1,
"patent_granted_count": 0,
"scalability_claim_score": 0.78,
"api_available": true,
"core_tech_stack": ["Mobile", "Mapping", "Payment Gateway"]
},
"business_model": {
"pricing_model": "per mile + surge",
"revenue_streams": ["ride fares", "surge pricing", "business rides"],
"gross_margin_target_pct": 35.0,
"current_gross_margin_pct": 28.7,
"unit_economics_validated": true,
"burn_rate_usd_per_month": 23000,
"runway_months": 14
},
"go_to_market": {
"customer_acq_channels": ["referral", "mobile app", "social media"],
"distribution_partners": ["None"],
"sales_cycle_days": 16,
"avg_contract_length_months": 6,
"brand_awareness_score": 0.32,
"esg_statement_flag": true
},
"team_and_founding": {
"founder_count": 2,
"founder_prev_exits": 1,
"founder_industry_experience_years": 5,
"founder_leadership_score": 0.67,
"advisor_count": 3,
"team_size_total": 8,
"skillset_coverage": ["operations", "engineering", "product", "design"]
},
"funding_and_investors": {
"current_round": "Seed",
"total_funding_raised_usd": 250000,
"ask_amount_usd": 1500000,
"pre_money_valuation_usd": 7600000,
"notable_backers": ["AngelList syndicate"],
"use_of_proceeds": ["tech dev", "marketing", "hiring"]
},
"risk_and_coachability": {
"coachability_sentiment_score": 0.19,
"regulatory_risk_flag": false,
"competitive_risk_score": 0.43,
"business_continuity_plan_flag": true,
"pivot_history": 1
}
}
Field Group & Feature Explanations
Market Opportunity (market_opportunity)
tam_usd_billion/sam_usd_billion/som_usd_billion: Size of target markets; gauges venture scale3.
market_growth_rate_cagr_pct: Underlying market CAGR — investor focus for upside.
market_trend_description: Qualitative context, e.g., regulatory tailwinds.
Business Traction (business_traction)
traction_metric_label/value: Key results (users, clients, pilots).
annual_revenue_usd/mrr_usd: Real financial traction for revenue-stage startups12.
active_users/monthly_user_growth_pct: Audience and velocity.
customer_retention_pct/churn_rate_pct: Stickiness and loss rate2.
customer_lifetime_value_usd/customer_acquisition_cost_usd: LTV/CAC ratio signals path to profitability.
pilot_partnerships: Early external validation.
Technology & Product (technology_product)
tech_readiness_level/product_stage: Maturity; critical for technical risk.
unique_value_proposition: Short product differentiator.
patent_app_count/patent_granted_count: IP defensibility indicator5.
scalability_claim_score: Data- or narrative-based facilitation of scaling.
api_available/core_tech_stack: Platform openness and tech base.
Business Model (business_model)
pricing_model/revenue_streams: Competitive intelligence, business defensibility1.
gross_margin_target_pct/current_gross_margin_pct: Margin analysis2.
unit_economics_validated: Are numbers supported with data?
burn_rate_usd_per_month/runway_months: Financial endurance.
Go-to-Market Strategy (go_to_market)
customer_acq_channels: Where and how are users gained?
distribution_partners: Broader reach potential.
sales_cycle_days/avg_contract_length_months: Go-to-market speed.
brand_awareness_score: Proxy for market mindshare.
esg_statement_flag: ESG alignment for modern capital pools5.
Team & Founding (team_and_founding)
founder_count/founder_prev_exits: Leadership and pattern recognition4.
founder_industry_experience_years/founder_leadership_score: Domain expertise and soft signals.
advisor_count/team_size_total/skillset_coverage: Depth and breadth.
Funding and Investors (funding_and_investors)
current_round/total_funding_raised_usd: Progression and traction.
ask_amount_usd/pre_money_valuation_usd: Deal terms and ask.
notable_backers/use_of_proceeds: Credibility and strategy.
Risk & Coachability (risk_and_coachability)
coachability_sentiment_score: NLP/VC feedback–driven adaptation likelihood.
regulatory_risk_flag/competitive_risk_score: Major execution hazards.
business_continuity_plan_flag: Preparedness for disruption.
pivot_history: Past responsiveness to market signals.
Risks
• Market metrics (TAM, CAGR, traction) – numbers may be inflated or use undefined segmentation; cross-check against external market reports.
• Technical readiness & IP – TRL labels are self-declared, and patent counts may include provisional filings only; verify with USPTO or code repo inspection.
• Business model parameters (pricing, CAC, cash-flow projections) – slide assumptions are often best-case and exclude churn or overhead; normalise to comparable cohorts.
• Team credentials – resumes can cherry-pick titles; run name disambiguation against LinkedIn and previous exit data to avoid attribution errors.
• Strategic-fit assertions (partnerships, sustainability) – claims of “signed LOI” or “carbon-neutral” may lack legal binding; require document evidence before scoring.
References
https://www.odemuno.com/projects/generative-ai-for-due-diligence
https://ltse.com/insights/the-metrics-that-should-be-in-your-pitch-deck
https://maccelerator.la/en/blog/entrepreneurship/key-metrics-to-include-in-startup-pitches/
https://www.whitepage.studio/blog/key-metrics-to-include-in-your-pitch-deck-a-guide-for-success
https://www.creditsuite.com/blog/top-key-business-metrics-investors-want-to-see-in-your-pitch/
https://vakilsearch.com/blog/what-are-key-metrics-in-your-pitch-deck/
https://alejandrocremades.com/what-are-the-key-metrics-to-include-in-your-pitch-deck/